Operational Dashboard
Using the Operational Dashboard, you can configure a dashboard to show how an event and a set of tasks are progressing towards completion. You set the criteria, including event, time constraints, labels, and status indicators (colors).
For example, you may have a service level agreement with a third-party company to send out offer letters with 24 hours after an event is launched. You can set up the operational dashboard to track this.
Key info
- Click Configure Data to set criteria that builds the dashboard.
- You must be on a team with the Report - Configure Operational Dashboard privilege to configure this report.
- You must be on a team selected during configuration to view the report.
- Click a bar to drill down to display all the events that make up that bar.
- When viewing the drill-down data, clicking an employee name links to the Event Summary (with Task List) and the event coordinator name links to their dashboard so you can review that user's workload.
Report results
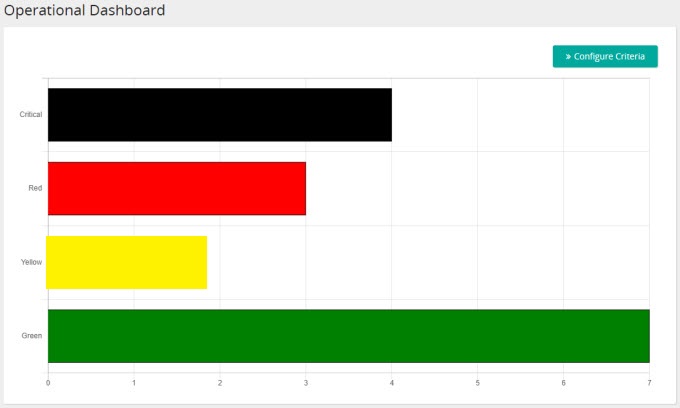
Results vary based on how you configured the dashboard. Here's a sample:

Good to know
- Black bar means critical (time remaining is overdue).
- Red and yellow bars mean whatever you defined them as.
- Green bar means the start action has occurred, the met action has not occurred, and the red and yellow configured time frames do not apply yet.
In this section |
| ©2022 SilkRoad Technology. All rights reserved. |
| Last modified on: 11/11/2020 3:32:38 PM |